In recent weeks, images of widespread snowfall have featured prominently in media coverage of the Italian winter. Snow-covered landscapes and locally significant accumulations have contributed to the perception of a season that is finally more generous. However, when discussing snow water resources, visual perception is only part of the story. To understand how much water is actually stored in the snowpack and what its hydrological contribution may be in the coming months, it is necessary to complement images with a quantitative analysis that can vary significantly from one area to another.
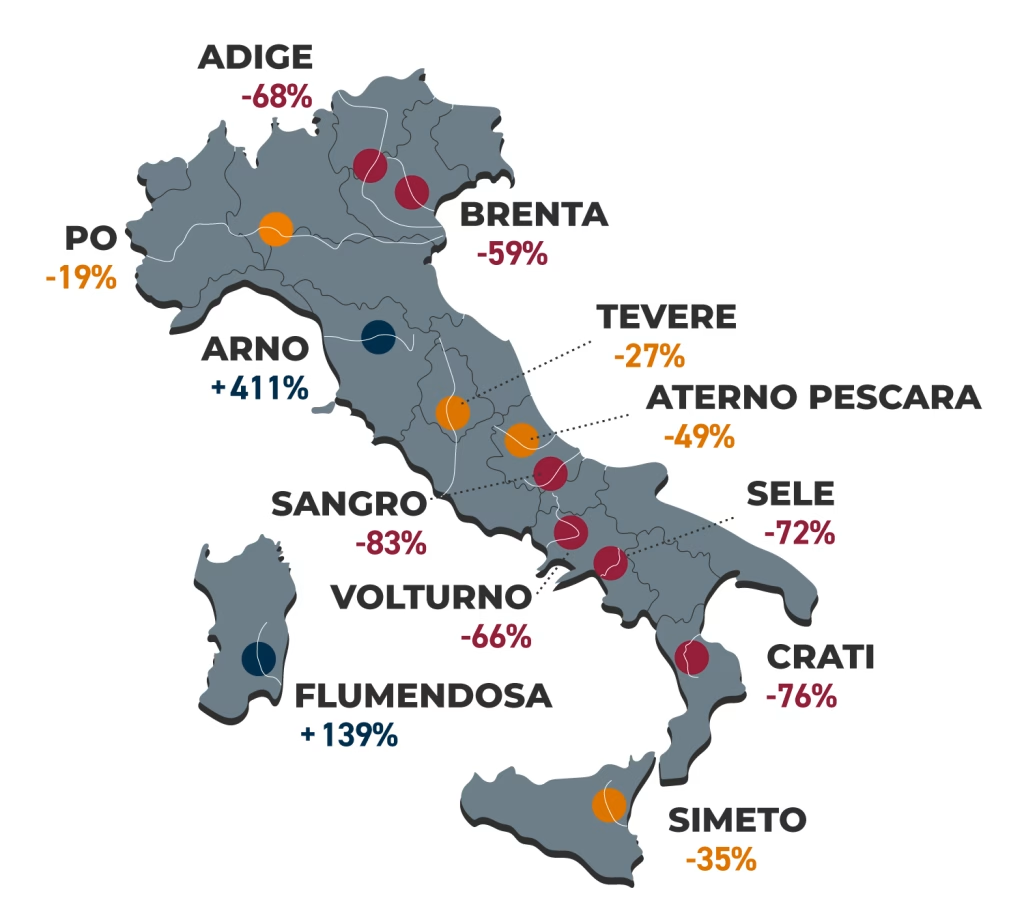
The second update from Fondazione CIMA on snow water resources outlines an overall improvement compared to mid-December, with a national deficit currently around -33%.
This figure points to a partial recovery, but it also conceals a marked spatial heterogeneity. Snow, in fact, does not distribute uniformly: it varies from basin to basin, from valley to valley, and above all with elevation.
North-West: a recovery shaped by elevation
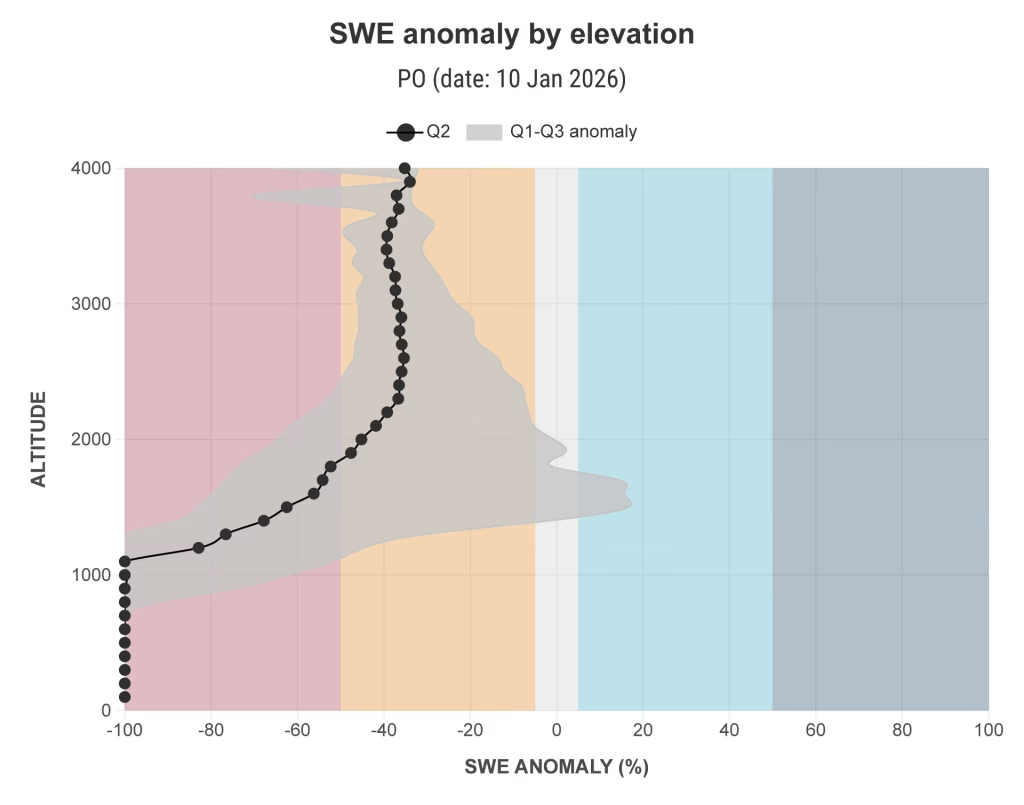
In North-Western Italy, between late December and early January, the most substantial accumulations are observed. The Po River basin has returned within the range of normal interannual variability, with a limited deficit of approximately -19%, thanks to the pre-Christmas snowfalls.
However, even under these apparently favourable conditions, the elevational distribution plays a key role. At elevations around 1,500 metres, some areas show conditions close to or above the average, while at higher altitudes snow accumulation remains below expected values. This is particularly relevant, because snow at higher elevations is the portion that contributes most effectively to spring and summer water reserves.
The “Prato Nevoso case”: when snow makes the headlines
On 30 December, images and reports from Prato Nevoso brought snow back into the media spotlight, giving the impression of an exceptional event. But what do the data indicate when we place that day in a historical perspective?
To address this question, we compared the SWE recorded in Prato Nevoso on 30 December for each year from 2010 to 2025. The result is clear: this year’s value is certainly high and indicates a very good accumulation, but it is not a record. In at least three recent winters (2010, 2013 and 2019), accumulation on the same date was higher.
In other words, what appeared “extraordinary” is largely extraordinary in terms of perception: increasingly, we are no longer used to winters with regular precipitation and a snowpack able to build up continuously over time. When this happens, snow surprises us again. Yet the data show that, at least in this case, it is simply “a winter that is behaving like winter.”

North-East: the face of snow drought
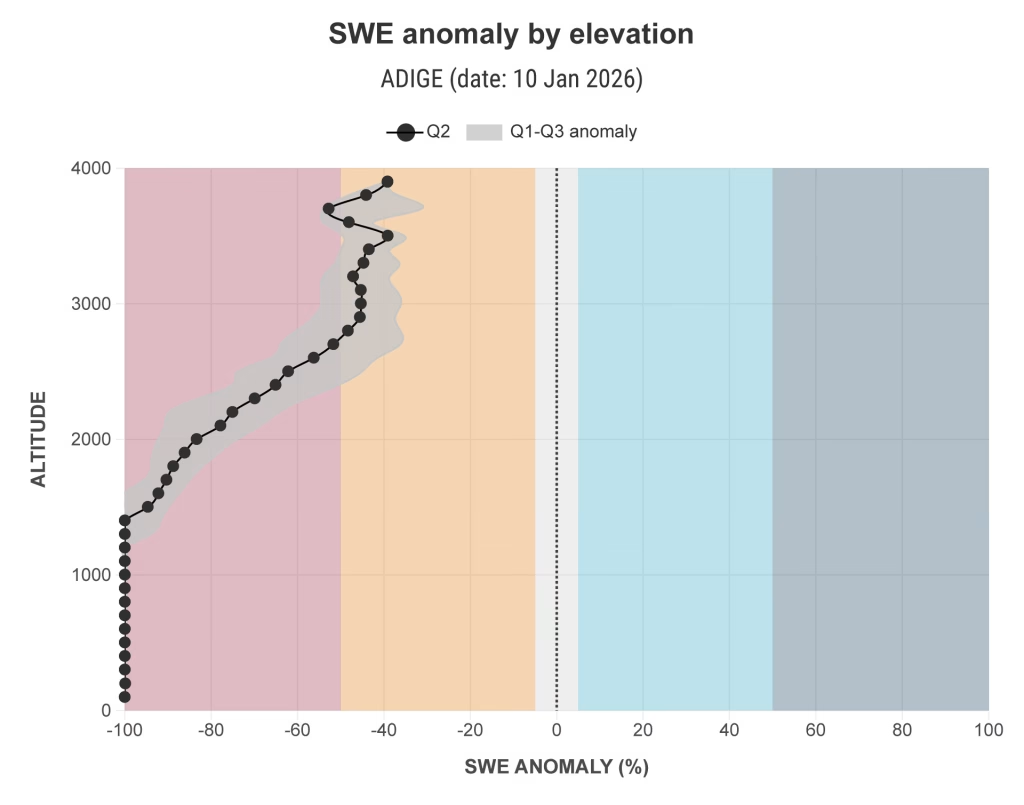
The picture changes markedly when moving towards North-Eastern Italy. In the Adige River basin, the deficit remains pronounced, around -67%, and SWE has been essentially unchanged since early December, due to the absence of new snowfall events.
The elevational distribution reflects a pattern typical of snow droughts1: very limited accumulation at mid- to low-elevations and still significant anomalies even above 2,000 metres. If persistent, this situation could affect water availability in the months ahead.
Apennines: signs of recovery, but snow remains ephemeral
Across the Apennines, an improvement is observed compared to mid-December, but the overall deficit remains high, around -47%. Early-winter snowfalls have not translated into a consolidation of the snowpack, largely because of elevated temperatures, which have promoted rapid melting.
As a result, the so-called ephemeral snow 2: persists: short-lived snow typical of mid-elevation areas in the Apennines, with a limited capacity to function as a seasonal water reserve.
Elevated temperatures and uneven precipitation
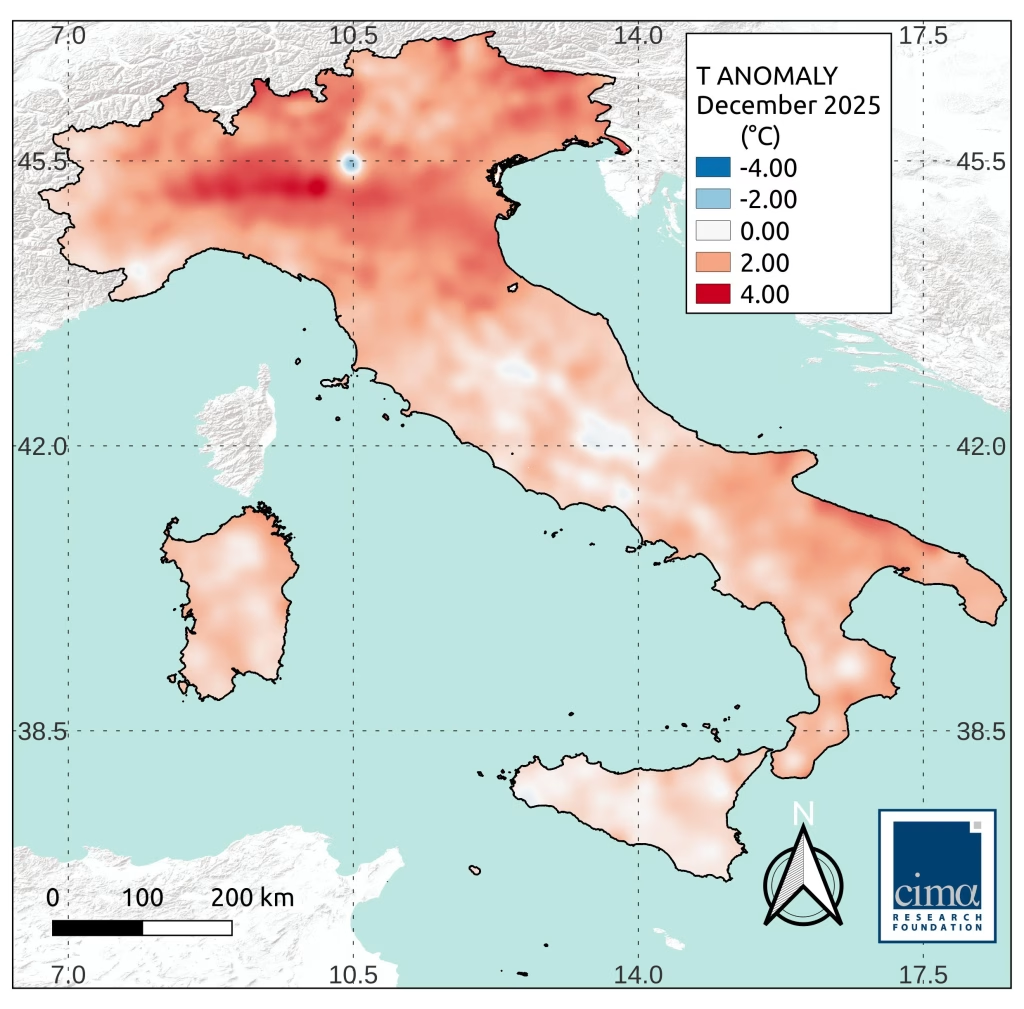
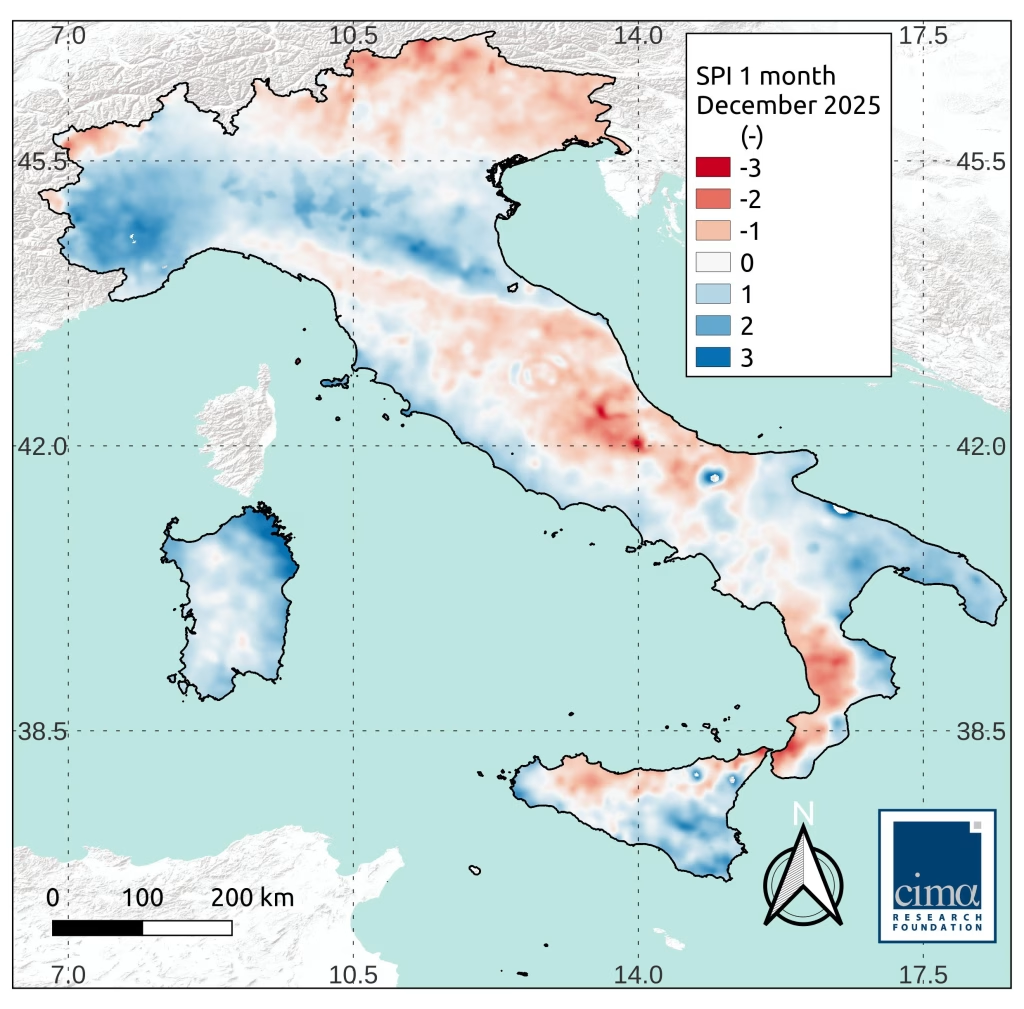
These patterns reflect a combination of drivers that has become increasingly recurrent. December was characterised by above-average temperatures across much of the national territory, particularly in the central and eastern Alpine sectors. This was compounded by a strong heterogeneity in precipitation: abundant in the North-West, but scarce in the North-East and in Central Italy. The interaction between high temperatures and the lack of new snowfall events has slowed the accumulation of snow water resources precisely in some of the most sensitive areas.
What to expect in the coming weeks
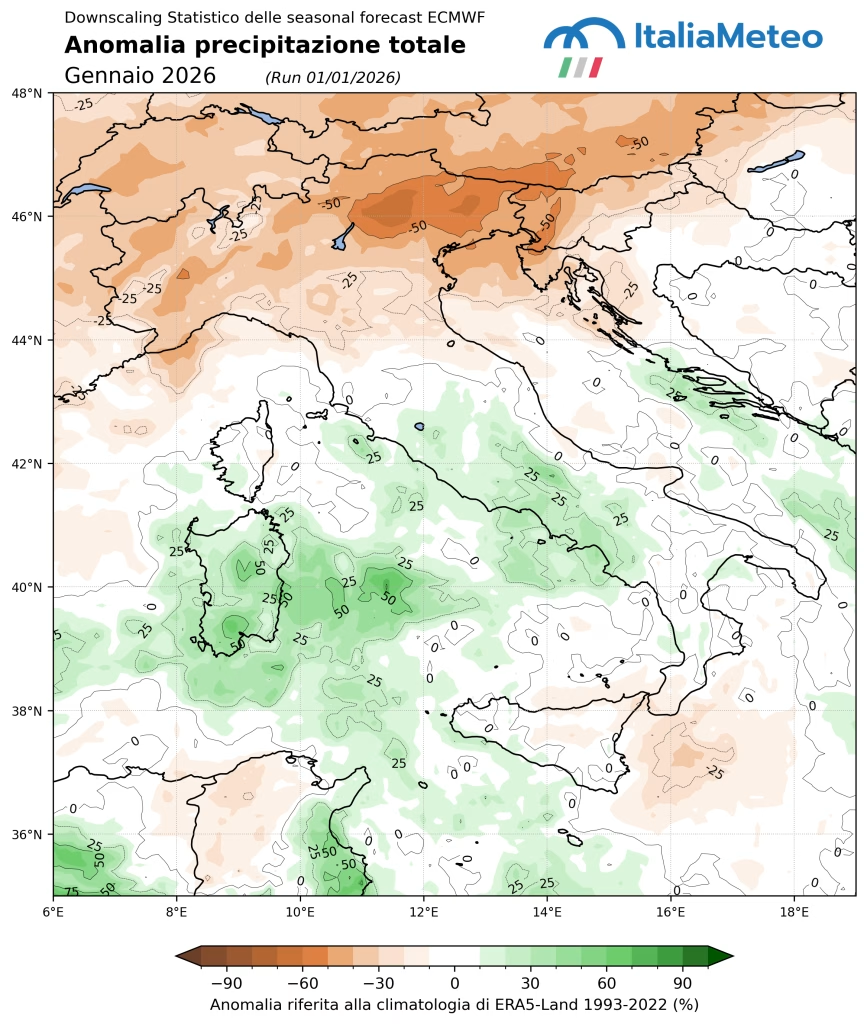
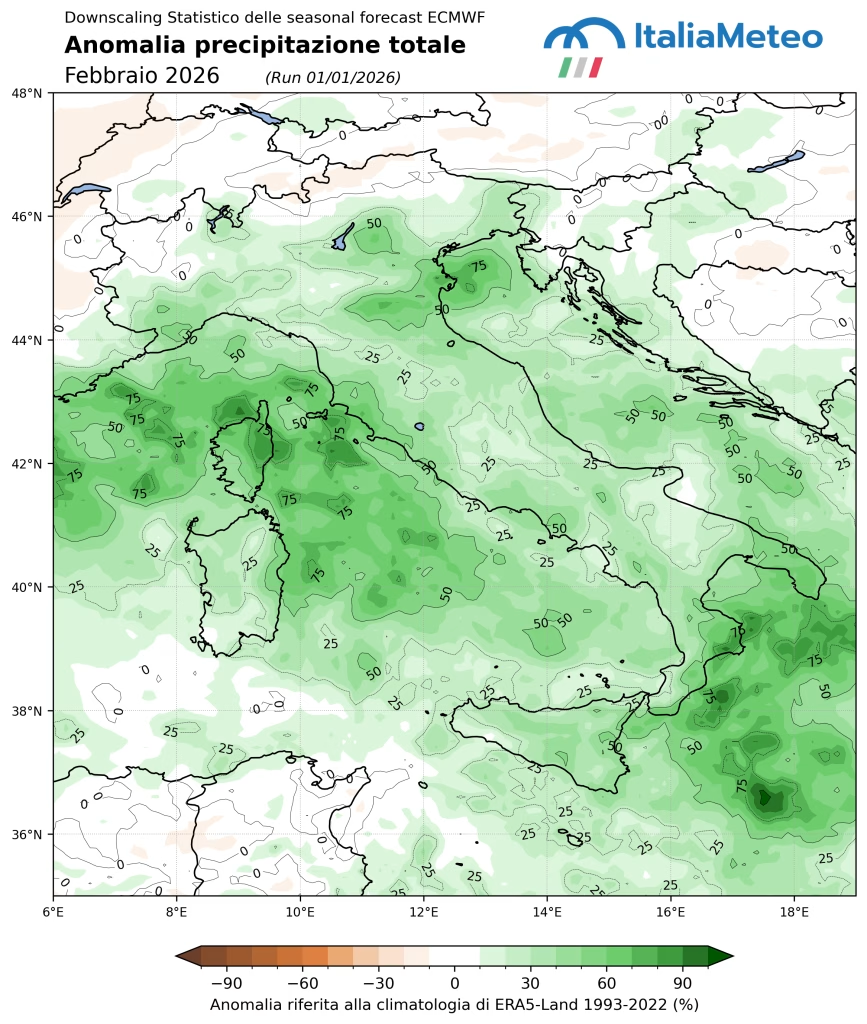
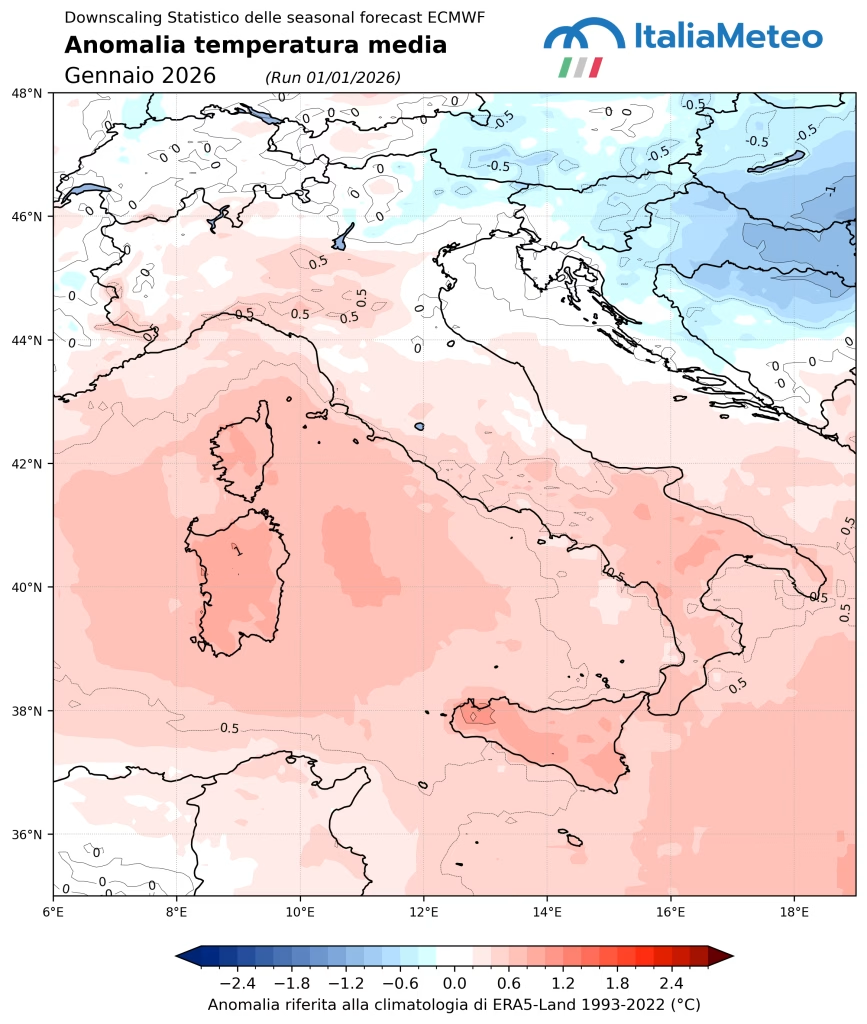
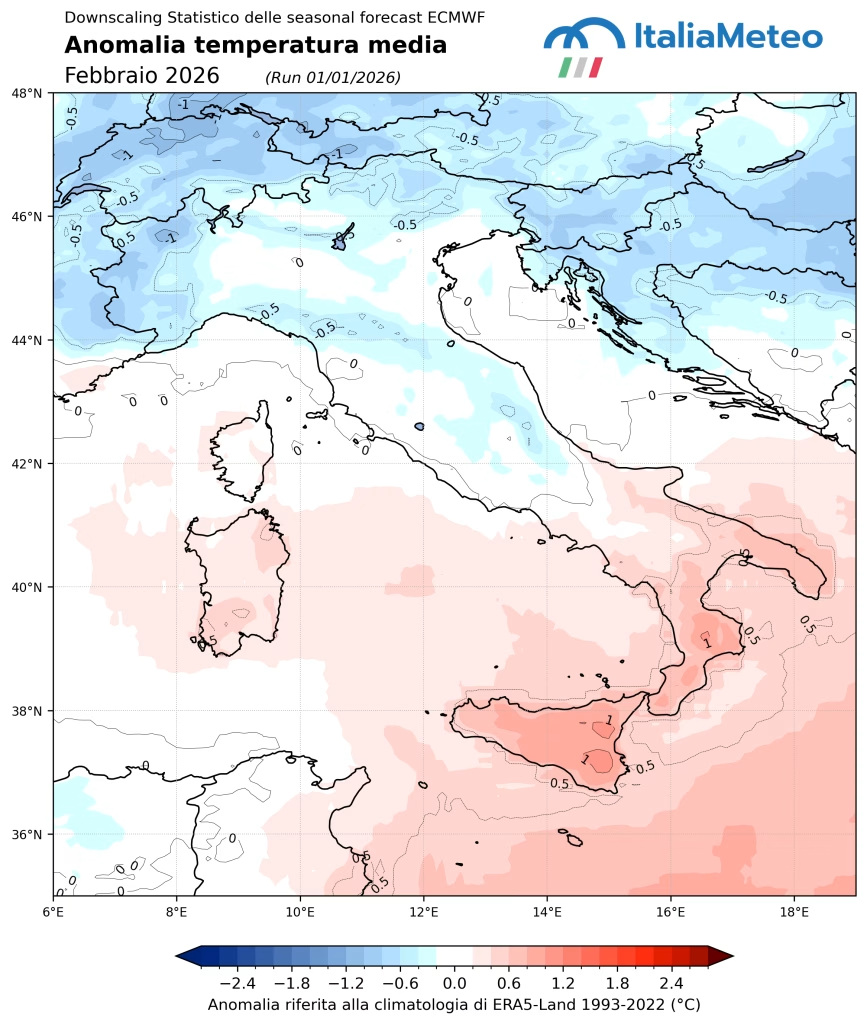
Seasonal forecast indications outline an articulated picture for the coming weeks as well. Precipitation may affect Central-Southern areas more strongly, while Northern Italy—and North-Eastern regions in particular—may remain below average during January. Temperatures are expected to be above average across much of the country, with some regional exceptions, and February also shows differentiated signals between North and South.
Overall, winter is still in an intermediate phase. Some basins have shown signs of recovery, while others continue to experience more pronounced deficits. The evolution of the next months will be crucial to determine whether snow water resources can strengthen further, or whether the observed differences will tend to consolidate. Continuous monitoring therefore remains essential to support the interpretation of a resource that, although invisible for much of the year, plays a central role in the country’s hydrological balance.
- The term snow droughts refers to periods characterised by an abnormal reduction in winter snow accumulation (which may result from below-average precipitation or from high temperatures that hinder snow build-up), which anticipate and intensify the summer melt process. ↩︎
- We had already discussed this topic here. ↩︎