The latest data (updated February 15, 2023) confirm the persistence of a deficit condition at snow water resources nationwide (-45%), with peaks in the Alpine area (-53%), particularly in the Po River basin (-61%)
As we have had occasion to mention on our website (here and here), the situation in Italy, as far as snow scarcity is concerned, is anything but good. Reduced precipitation, combined with mild winter temperatures that have anticipated the melting of snow on the mountains, have in fact led to a significant – and, in perspective, even serious – deficit, because it is precisely the water contained in snow that provides the water supply for the spring and summer months. In other words, the scarcity of snow this winter 2022-23 is likely to exacerbate the drought that already affected the peninsula last year.
Given the importance of this issue, therefore, we would like to continue the update by reporting the latest available data on snowfall and Snow Water Equivalent, a parameter that essentially represents the water contained in snow.
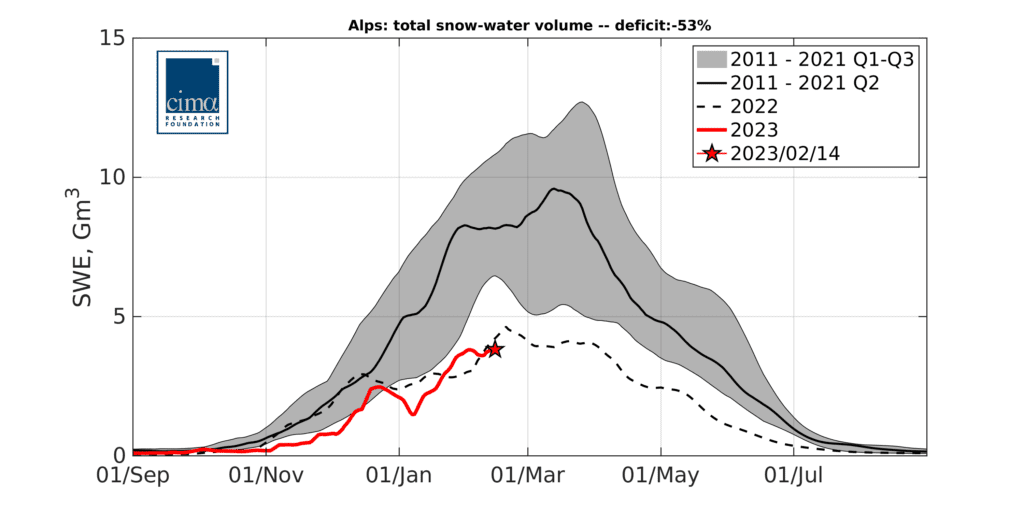
The data are collected by CIMA Research Foundation with the S3M model, combined with the IT-SNOW tool (which enables a nationwide reanalysis of snowfall conditions), integrating measurements from ground-based sensors with information from satellites. As of Feb. 15, the snow deficit stands at around -45 percent: despite the snowfall at the end of February, therefore, the situation appears to have worsened, partly due to gradually milder temperatures.
In particular, we point out that the deficit of the snow water equivalent in the Alps (which represent the most important water reserve in the country, since they supply the Po River basin) is -53% compared to the average of the last ten years; thus, it remains more or less stable since our last update and comparable to that of last winter.
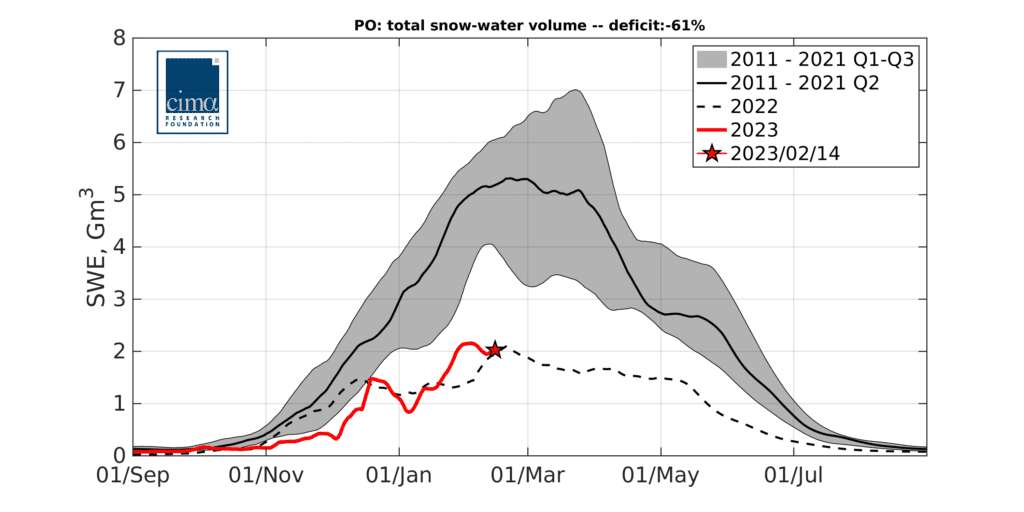
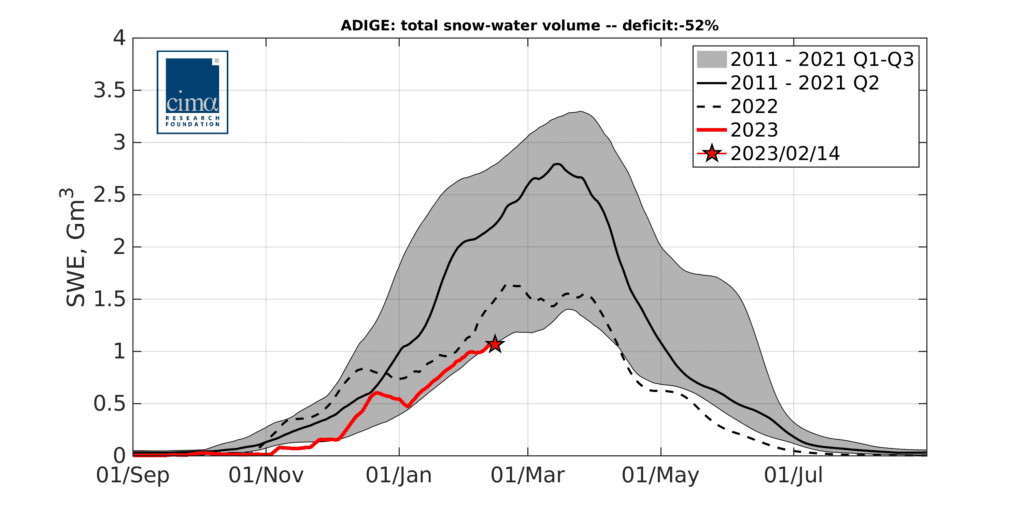
As for the Apennines, it is important to point out that the snow is already (and again) melting, due to rising temperatures. However, this is a typical dynamic in these areas, in which intense snowfall, especially in late winter, quickly gives way to rapid melting of the snowpack at the lower and middle elevations.
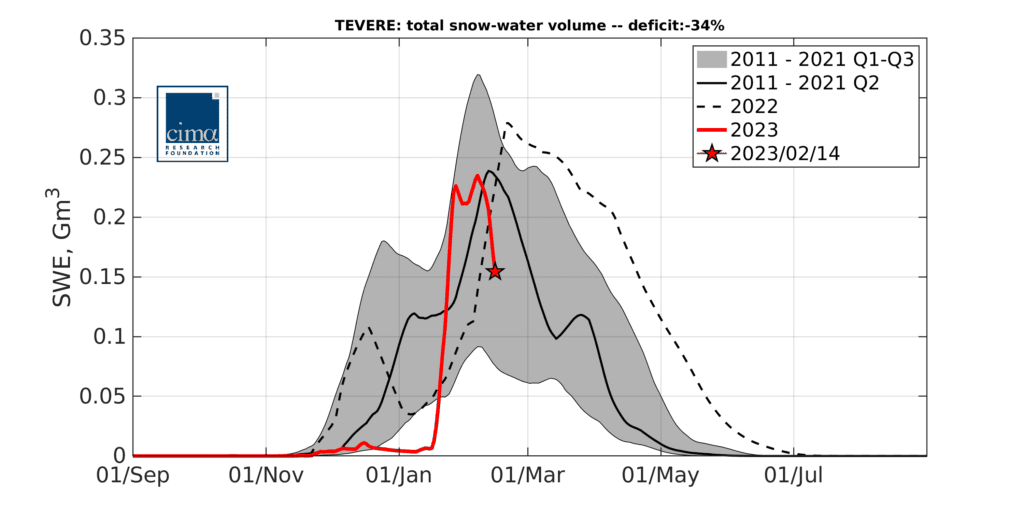
From a historical perspective, there is about a month left for snow accumulation, as the peak accumulation in Italy occurs on March 4 ± 10 days. We will publish another assessment after the day of peak accumulation.
