Between January 5 and 6, 2026, a major flood event affected central Italy, involving several river basins, including the Aniene, Velino, Liri, and Aterno. Once again, advanced modelling tools proved essential for anticipating risk, monitoring the evolution of the event, and supporting operational decision-making.
From forecast to real-time monitoring
As early as the morning of January 4, meteorological models (ECMWF, ICON, WRFDA, WRFOL) indicated the potential for intense and widespread rainfall. These early warning signals were strengthened by the use of the Multi visualization tool, which compares discharge forecasts across multiple models, and the Flash Flood system, which allows risk assessment at local scale.

The Aniene and Liri basins, among others, were immediately identified as areas with potential criticality.
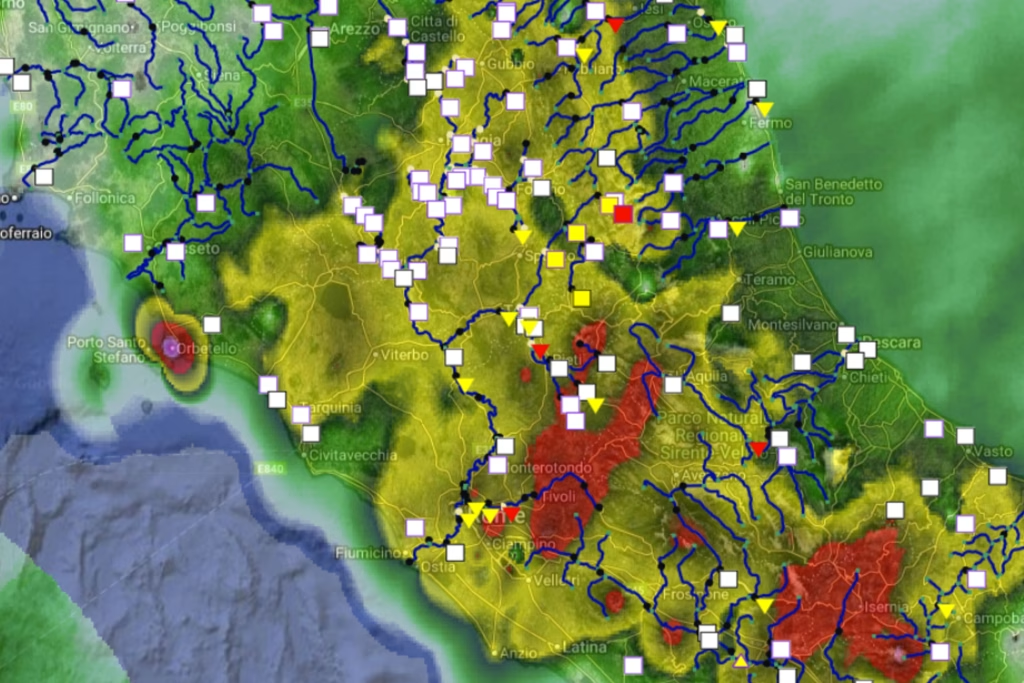
As the event unfolded, operations moved into the nowcasting and monitoring phase, enabled by multiple tools integrated within the Dewetra platform. In particular, the BeCoMe system provided rainfall forecasts every 30 minutes, driving the short-term hydrological model and allowing near-real-time visualization of hydrological severity, including on the secondary network.
Despite some limitations due to a temporary reduction in radar coverage during this period, the algorithm provided valuable information to monitor threshold exceedances and identify the most critical sections.

The Aniene case: a concrete example
In the Aniene basin, at Lunghezza, model outputs already indicated a marked rise in river discharge during the night between January 4 and 5. Although the hydrological forecasts showed a slight underestimation during the initial phase, they successfully captured the event’s dynamics, offering practical support to authorities involved in flood monitoring.

During January 5, many branches of the secondary network recorded medium to high severity levels, as also confirmed by observations collected the following day, when the event was subsiding.
An integrated system for civil protection
Once the event had concluded, maps of observed precipitation—generated through merging radar and rain gauge data via the MCM algorithm—and hydrological simulations based on real observations validated the initial forecasts, demonstrating strong consistency between model predictions and field measurements.


This event highlighted the importance of having an integrated forecasting and monitoring system capable of combining meteorological and hydrological modelling with real-time observations.
Such systems not only allow anticipation of flood impacts but also enable more effective direction of civil protection actions, contributing to risk reduction for both populations and territories.