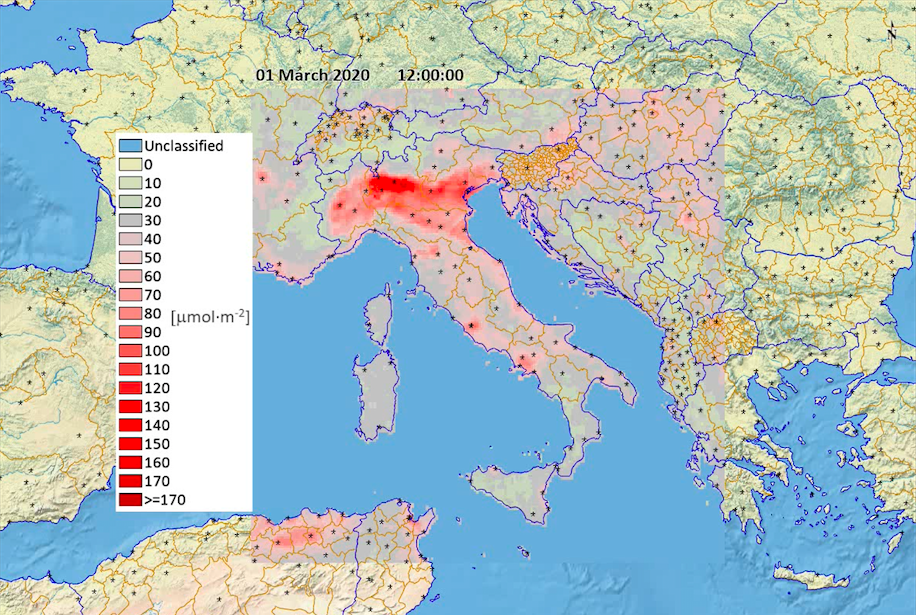
CIMA Research Foundation researchers used the data provided by the ESA Sentinel-5P satellite to produce maps of nitrogen dioxide concentration trends, one of the most toxic air pollutants
From space, satellites can give us a lot of information about what is happening on our planet. For example, they can help in the assessment of the impact and extent of natural disasters, such as floods or forest fires, by providing data on climate, hydrology, built infrastructure, etc. Satellites can also be used to analyze air pollution and the concentration of gases that are toxic to humans and contribute to the greenhouse effect.
Researchers in our Earth Observation Department have started working on analyzing satellite data provided by the European Space Agency Sentinel-5P to produce daily maps that monitor NO2 (nitrogen dioxide) concentrations over time. NO2 is an irritant agent, one of the most toxic to humans, that is “largely produced by anthropogenic activities, such as the combustion of biomass and fossil fuels”, explains Elisabetta Fiori, one of the department’s researchers.
Analyzing the concentrations of pollutants, such as nitrogen dioxide, and their variations in space and time allows for a better understanding of their dynamics and the factors that influence them. To do so, satellites are an invaluable resource. Sentinel-5P is equipped with a sensor, called TROPOMI (TROPOspheric Monitoring Instrument), which uses passive remote sensing techniques to achieve its objective by measuring, in the upper part of the atmosphere, the solar radiation reflected and radiated from the earth. It is thus able to provide measurements in ultraviolet, visible, near infrared, and partly in real infrared.
Some of the data acquired by Sentinel-5P was used by our researchers for a short video, which we can be found here. It shows the trend of nitrogen dioxide concentration in Italy between the first days of December 2019 and March 19, 2020. “These images tell us daily the distribution of NO2, calculated with a weighted average of the previous ten days: in short, we can observe the trend of the concentration even a few days away from today and evaluate the variations”, Fiori concludes. “This information will help us to monitor air quality, to identify the areas most at risk and also possibly evaluate the possible effects, in terms of air pollution, of the nationwide lockdown”.