We had a chat with Massimo Milelli, head of the Meteorology and Climate Department of CIMA Research Foundation, about the “urban heat island effect” which sees temperatures in urban areas higher than in the surrounding rural areas. Dr Milelli tells us about a work that starts from the more strictly technical and scientific aspects to direct involvement of the citizenry for data collection and the study of adaptation and mitigation solutions
In the summer months, heat can certainly be a nuisance, or even a problem – especially in cities, which are known for the phenomenon of “heat islands,” aggravated by the excessive urbanization that, unfortunately, also occurs in Italy.
How do we study heat islands? Can we predict them? He works both on the more strictly scientific aspects (and on their integration into weather forecasting models) and on aspects that also involve citizenship. Now that summer is advancing, Dr Milelli seemed the perfect person with whom to exchange a few words on this topic.
A few words on heat islands
In the scientific literature they are referred to as “urban heat islands” (UHIs): a phenomenon whereby the temperature of urban areas, the more built-up ones, is higher than in natural and rural areas. The temperature difference is particularly significant during the nighttime, that is, the very hours that, at least in summer, should be able to ensure that we can “breathe a little.” This phenomenon is not just a nuisance. It can, instead, be a real detriment: high temperatures cause heat stress, which can lead to heat strokes and other ailments such as heat exhaustion and cramps, dehydration, and so on. In addition, UHIs can increase the concentration of air pollutants, and worsen the air quality. Finally, according to some studies, they may also affect convective precipitation, making city thunderstorms more intense and frequent than in the surrounding rural areas.
The causes of heat islands are easy to guess. “The concrete of buildings and roads absorbs solar energy to a much greater extent than the earth and vegetation; at night, it releases the accumulated heat into the air. The impact of heat islands is becoming more and more significant, precisely because urbanized areas are continuously increasing, as are the people who live there and are therefore exposed to the phenomenon,” Dr Milelli says.
Representing heat islands in weather forecasting models
It becomes clear, therefore, that understanding the characteristics and dynamics of heat islands assumes a relevant role in protecting the well-being of the population. It is important to represent them correctly, so that those living in the area can be alerted and precautionary measures can be encouraged. Dr Milelli, with colleagues from the field of Meteorology and Climate and from national and international agencies, began this journey several years ago. “Our study originally had a strictly modelling point of view: that is, we wanted to make sure that forecasting models could indicate as accurately as possible the intensity and the extension of heat islands. The first part of this research was published in 2021 and focused on the COSMO model, which is also used operationally for weather forecasting in Italy, according to the DPCM released on 27 February 2004″, the researcher explains.
Since 2020, however, the COSMO consortium has adopted another model, ICON, which is implemented at the national level and will replace COSMO at the operational level as well. As a result, it is now necessary to make sure that ICON also has the “instructions” necessary for heat island description. This is exactly what Dr Milelli’s team is focusing on. “Unfortunately, numerical models are not all the same.” Dr Milelli says. “In other words, the equations have to be inserted at the correct point in the algorithm if we do not want them to change the results at points where they should not. In the case of heat islands, for example, the integration of the scheme is for the urban area, so it should not change the temperature in natural areas. This is one of the main challenges – we can say, however, that we are well underway with the work.”
Urban heat islands and citizen science
More recently, these research activities have been joined by other activities that instead call into play the participation and active involvement of citizenship. In fact, the importance of the role of citizenship when it comes to environmental risks and natural events is also emphasized by European policies. Being informed and involved, in fact, helps on the one hand to know and be aware of risks and, on the other hand, to legitimize the choices and decisions of institutions. In addition, as we had also reported a short time ago, citizens can provide a concrete contribution to scientific activity: this is the core of citizen science, that vast set of activities that, in general, sees the population involved in the collection and analysis of scientific data.
CIMA Research Foundation is involved in two projects whose key words are citizen science and involvement. The first is I-CHANGE, which involves a series of actions (from the creation of living labs to citizen science activities) aimed at increasing the involvement, and with this the awareness, of citizenship on the issues of climate change, environmental protection and sustainable development. The second is AGORA, for which the involvement of the population has a focus more closely related to climate change adaptation: its goal is to create places and pathways for co-design and co-creation of innovative adaptation solutions. Both projects are funded under the European H2020 program.
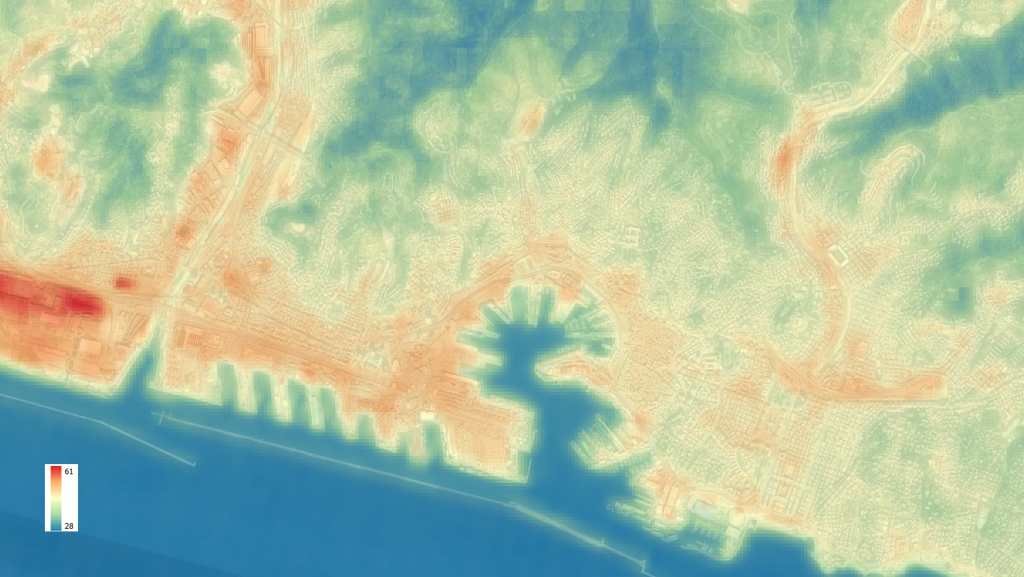
“For example, in Liguria as part of I-CHANGE, we provided meteotrackers, small and lightweight instruments that can be carried around easily and that allow environmental data to be collected during daily or recreational activities (this is the case with those provided to bikers of the local Turchino Outdoor Resort ASD amateur sports association),” Dr Milelli says. “These data also cover urban areas. As far as the Ligurian territory is concerned, for example, in July we had some measurement campaign along the coast and, thanks to the meteotracker, we could see not only how the heat is concentrated in the main urban area (Genoa) but also how the highest temperatures are those in the city centre and decrease in the surrounding area. Differences in temperature can be as high as 3 degrees. With these data, we will be able to work on the public awareness part – especially when it is the public itself that collected them – and on other stakeholders, such as institutional stakeholders, to devise adaptation and mitigation solutions.”

“Beyond good self-protection rules, there are several solutions that can help in risk mitigation when it comes to urban areas,” the researcher concludes. “Simple things can help: increasing green areas, using materials with high reflection properties that do not absorb heat, creating artificial ponds… It’s all about finding the best solution depending on the location, also reasoning with those who live there.”
In the cover image: Land Surface Temperature (LST) map of Genoa on 26/06/2023, h 12.10, derived from Landsat 8 satellite. Temperature is in celsius degrees and refers to the ground surface (not to the air). Urban surfaces are much hotter than vegetated surfaces. (Landsat Level-2 Surface Temperature Science Product by courtesy of U.S. Geological Survey.)