Between the 5th and 9th of December 2020, in Italy intense rains fell, leading to floods in different areas. Researchers of CIMA Research Foundation were able to quickly provide the maps of the affected areas and estimate the depth reached by the water
The beginning of December 2020 has seen the Italian territory, especially in the north, affected by intense rains that led to localized floods. CIMA Research Foundation, on request of the Italian Civil Protection Department, has monitored the situation producing satellite maps of the flooded areas. From these maps it was possible to evaluate the extension of the flood and the depth reached by the water.
The first regions to be affected by the rains were those of the north-east of Italy, on December 5th and 6th, 2020. Through the portal myDEWETRA the cumulative rainfall amounts were established: they were between 300 and 450 mm in the provinces of Udine and Pordenone, in just 24 hours. In the province of Modena, the rivers Panaro and Secchia have broken their banks in several areas, while in Lazio the persistent rainfall has raised the level of the Liri river. After a day of respite, on December 8th the rain resumed its intensity, especially in Friuli Venezia Giulia and Lazio, both regions already affected in the previous days.
How was the mapping done to give a broader view of the impact of the rains? The first step is the processing of satellite data. The images used come from two types of satellites: those of the COSMO-SkyMed constellation, developed by the Italian Space Agency (ASI), and those of the Sentinel-1 constellation of the European Space Agency (ESA). Both these groups of satellites are equipped with a synthetic aperture radar (SAR), which is able to provide images even when the sky is covered with clouds and in the absence of light.
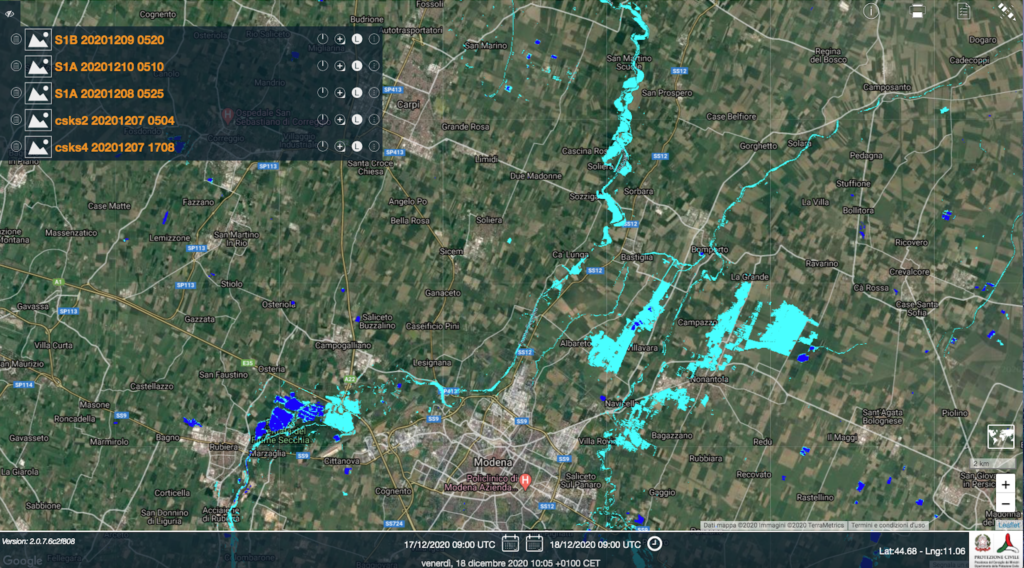
The researchers of the Earth Observation Department have processed the satellite images by applying algorithms developed by CIMA Research Foundation, thanks to which it was possible to obtain the maps a few hours after the event. “The maps were promptly published on the myDEWETRA platform. The COSMO-SkyMed images of the Modena district, acquired on December 7th, have allowed us to highlight differences with respect to the amount and extent of flooded areas. In the second one, acquired 12 hours after the first, there is a partial decrease of the areas with the presence of water in the areas of overlap of the two acquisitions, also demonstrating the slow runoff, due to the orography of the territory”, explains Luca Pulvirenti, head of the Earth Observation Department.

Map of flooded areas, December 7, 2020, h 7.00 UTC (COSMO-SkyMed acquisition)

Map of flooded areas, December 7, 2020, h 17.10 UTC (Acquisition COSMO-SkyMed)
“The maps derived from the Sentinel –1 acquisition performed on December 8th (in the early morning) allowed us to monitor the flood evolution in the Modena district, as well as to detect potentially critical areas due to flooding of some watercourses (such as the Bacchiglione, between Vicenza and Padua) clearly visible from the satellite”, continues the researcher. “On the morning of the 9th the Sentinel-1 swath covered an area extended from Lazio to Friuli. The result was a map that allowed us to further observe the slow evolution of the phenomenon occurred in the Modena area. It was also possible to identify flooded areas in different zones of Veneto, Friuli Venezia Giulia, Umbria and Lazio. Finally, on December 10th the product derived from the morning acquisition of Sentinel-1 was generated, allowing to widen the view also to the provinces of Rome and Frosinone. The analysis allowed to identify flooding also in the portion close to the border between Lazio and Campania, in correspondence of the mouth of the Garigliano river.”
The next step of the monitoring activity required to use the maps to estimate the depth reached by the water in the flooded areas. This process, already carried out for example in the case of the floods in Calabria in November, is based on the use of a tool developed by the University of Alabama, the Floodwater Depth Estimation Tool, “corrected” for the applications of the CIMA Research Foundation, combined with the digital terrain model (DTM) of the Emilia Romagna Region. “We estimated an average flood height of about 27 cm, over a total flooded area of 25 km2. The greatest depths were located in the immediate vicinity of the main hydrographic network along the Secchia and Panaro, while in the areas of greater areal extension of the flood, around the town of Nonantola, the depths were mostly less than one meter”, explains Simone Gabellani, head the Hydrology and Hydraulics Department.

Estimated flooding depths in the Modena area (left) and enlargement on the Nonantola area, (right). (CoOSMO-SkyMed acquisition of December 7, 2020, h 5.04 UTC)
“The possibility of processing satellite data in combination with instruments that also provide information on the amount of water in a flooded area is a very important opportunity for emergency management”, Gabellani concludes. “In fact, it gives us important indications on the impact that the rains had, in areas that are certainly not easily accessible at that time. In addition, this type of work, for which collaboration between different bodies and institutions is essential, can now be done in a timely manner, as demonstrated during these floods: and this is another element of great value when it comes to managing an emergency.”