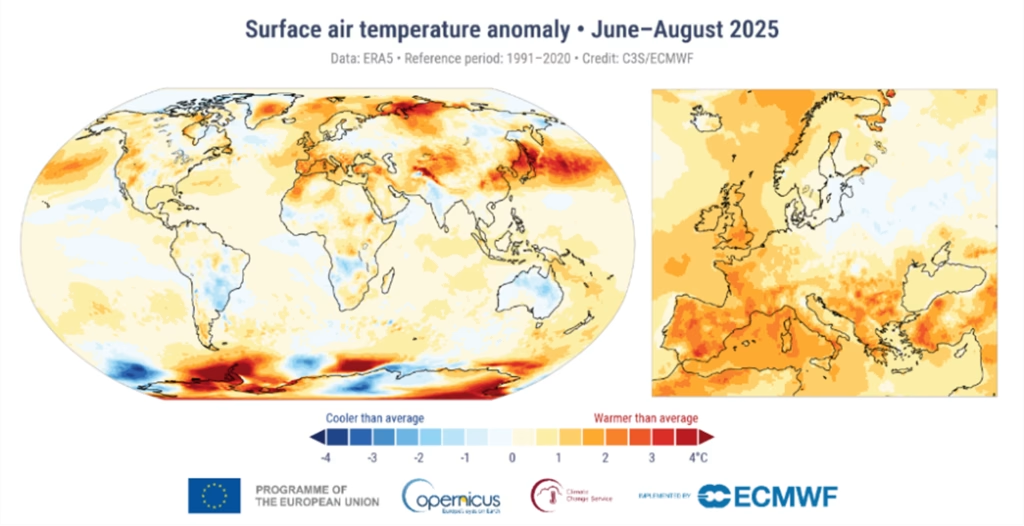
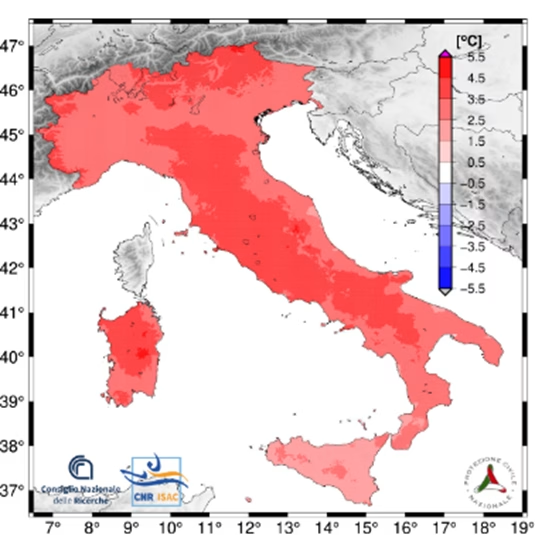
The meteorological pattern of summer 2025 was dominated by alternating phases of African subtropical high pressure and Atlantic disturbances. This configuration produced a widespread temperature anomaly, with departures between +1.5 and +2.5 °C from the 1991–2020 thirty-year average, more pronounced in Central and Southern Italy and in the islands.
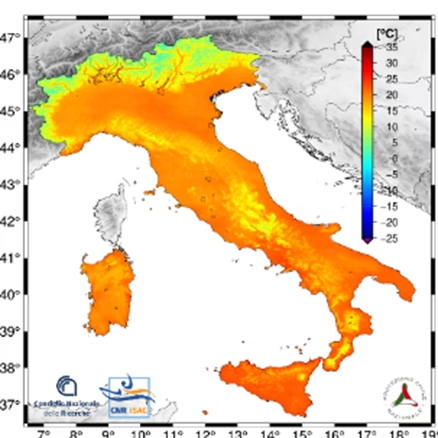
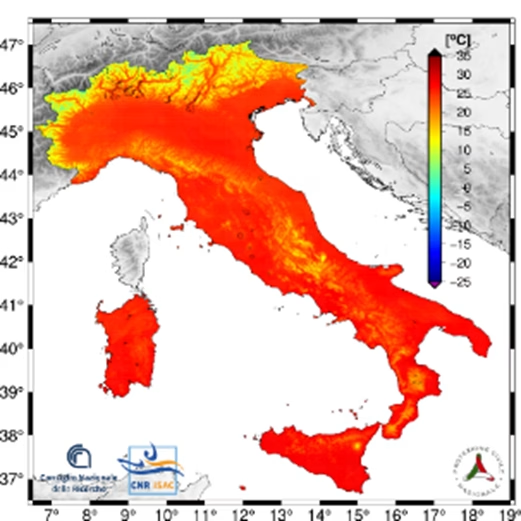
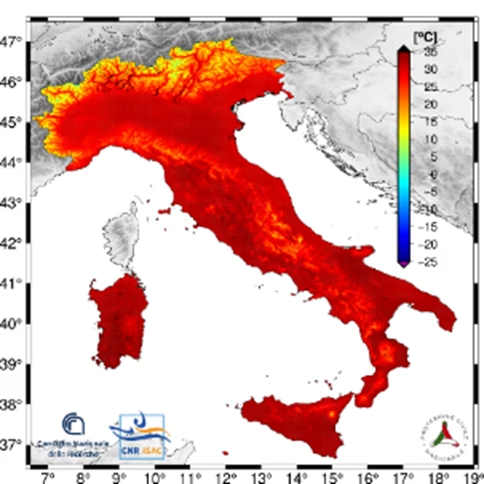
Mean minimum (left), mean (center) and maximum (right) temperatures for the summer season (source ISAC-CNR https://www.isac.cnr.it/climstor/climate_news.html)
June stood out as the most anomalous month: according to ISAC-CNR the national mean temperature was +3.02 °C above normal, making it the second hottest June ever recorded after 2003. The anomaly was more severe in the North, at +3.38 °C, but affected the whole country with +3.00 °C in Central Italy and +2.78 °C in the South.
At the atmospheric level, the persistence of an anomalous North-African anticyclone over the central Mediterranean contributed to this configuration, as also shown by geopotential maps1 produced by NCEP/NCAR.
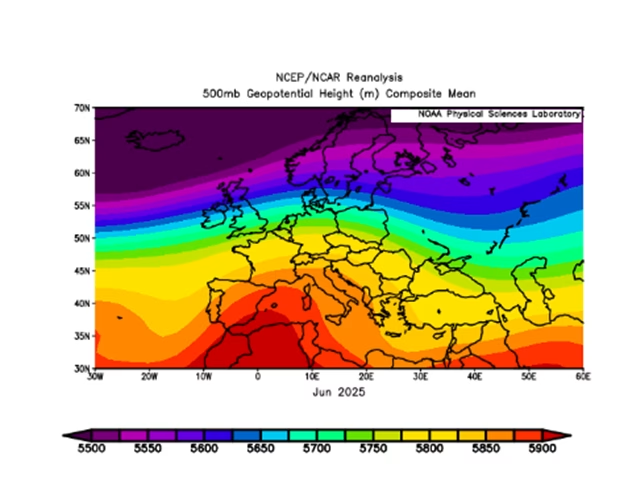
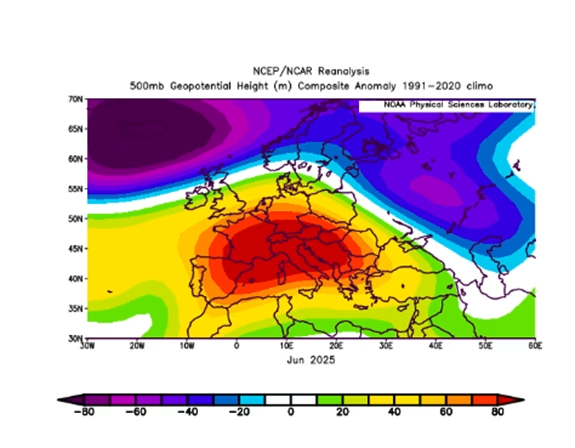
Average geopotential height in June (left) and its anomaly relative to the 1991–2020 reference period (source NCEP/NCAR Reanalysis https://psl.noaa.gov/cgi-bin/data/composites/printpage.pl)
The anomalies did not concern mean temperatures alone: significant deviations were also recorded for minimum and maximum temperatures, with nights much warmer than normal and days when maximum temperatures widely exceeded 40 °C in Central and Southern Italy. This increase in minimum temperatures had a particularly relevant impact on population well-being and on ecosystems, because the lack of nighttime cooling prevents thermal recovery and amplifies the effects of heatwaves.
July confirmed this trend, especially in the South and on the major islands, while in the North a negative anomaly of upper-level pressure partly mitigated temperature conditions (as we will see, this anomaly temporarily slowed down high-elevation snowmelt, although only marginally given the intense heat of the preceding month).
Finally, August introduced greater variability: intense heat alternated with intrusions of Atlantic air that produced strongly unstable convective episodes, with localized flash floods and hailstorms.
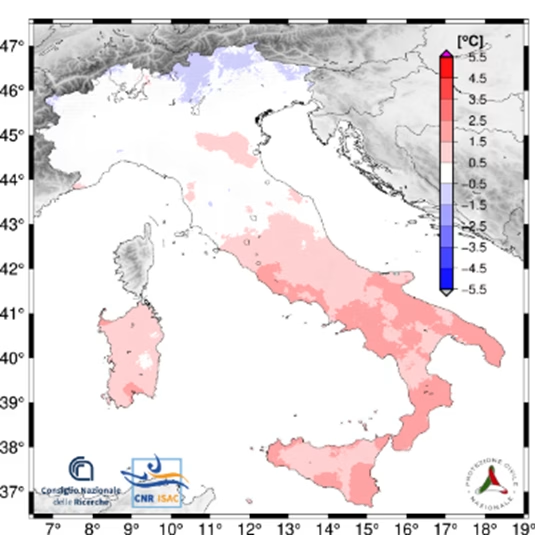
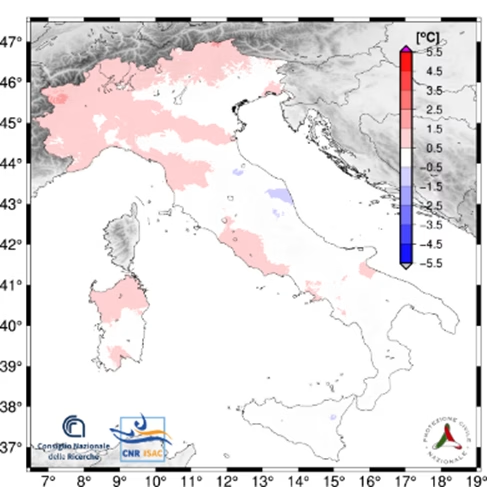
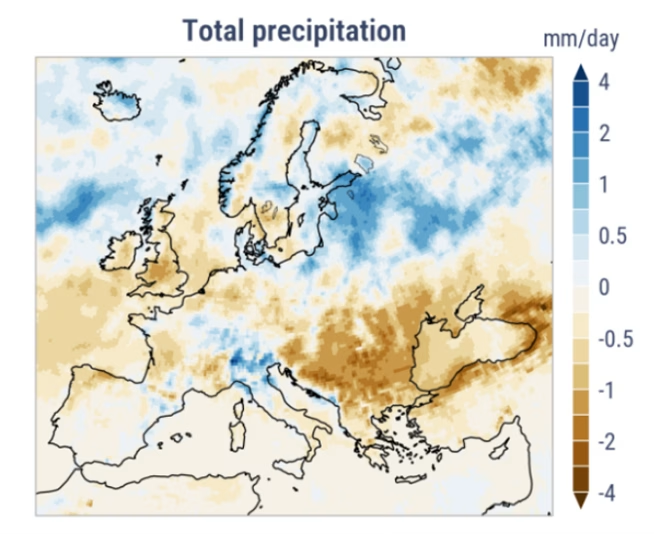
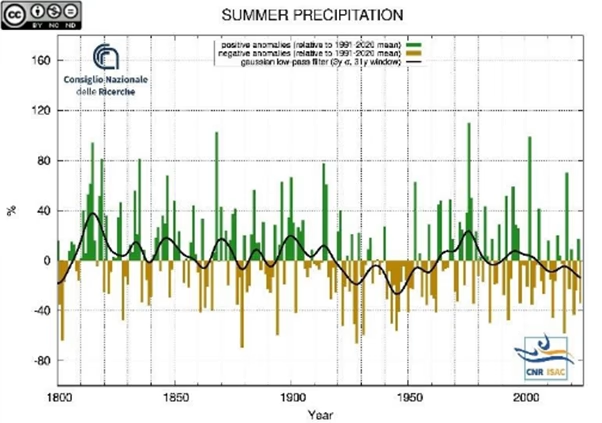
From a pluviometric standpoint, the season showed an extremely heterogeneous distribution. In the North and along the Alpine arc, accumulations were above average, often concentrated in short, intense events, while Central and Southern Italy experienced a season marked by persistent rainfall deficits. Precipitation anomaly maps produced by Copernicus and ISAC-CNR confirm this picture of strong territorial heterogeneity, which has now become a recurring feature of Mediterranean summers: localized, violent surpluses in the North; chronic and prolonged drought in the South.
- Geopotential maps represent the height of atmospheric pressure surfaces. They are a fundamental tool for interpreting large-scale meteorological phenomena, such as the distribution of high and low pressure areas, atmospheric circulation and the movement of air masses. ↩︎
