On March 14, 2025, a severe storm system hit Tuscany, bringing torrential rains and strong winds that triggered widespread flooding and caused significant damage across several areas. Within a few hours, the exceptional rainfall saturated the soil, leading to a rapid rise in river levels and extensive flooding. Hydrometric data recorded on March 15, 2025, indicate that many rivers in Tuscany exceeded alert thresholds, with particularly critical levels in the Arno and Serchio basins.

The situation worsened as the hours passed due to the continuous moisture inflow sustained by strong southwesterly winds, which intensified the event.
To understand the causes of this extreme weather phenomenon and assess its impact, CIMA Research Foundation conducted a detailed analysis, integrating advanced meteorological data and satellite imagery to reconstruct the event’s dynamics and support emergency management activities.
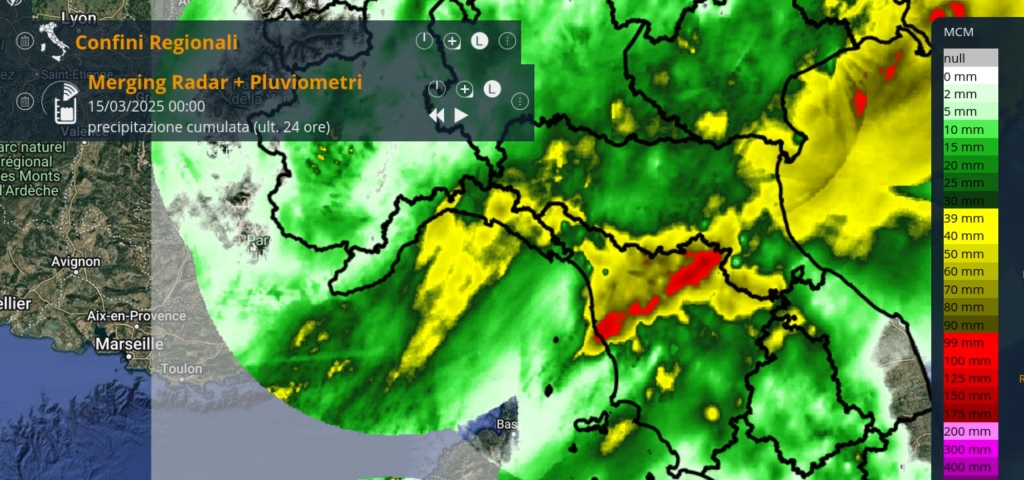
How much rain fell? Observed data
On March 14, 2025, Tuscany recorded exceptional rainfall accumulations in several locations. According to data provided by the LaMMA Consortium, the cumulative precipitation reached significant values:
- Province of Florence: up to 150 mm in 24 hours, with peaks of 180 mm in some stations.
- Province of Pisa: between 120 and 140 mm in 24 hours.
- Province of Livorno: average values of 130 mm in 24 hours, with local peaks up to 160 mm.
These figures represent extraordinarily high rainfall amounts, which contributed to the rapid rise of river levels and subsequent flooding. The spatial distribution of precipitation showed greater intensity in the inland areas of the region, particularly in the provinces of Florence and Pisa.

Why did it happen? A meteorological analysis
The flood event was driven by a low-pressure system over southern France, which channeled highly humid air masses toward Tuscany. “Imagine a large spiral of unstable air constantly drawing moisture from the ocean and the Mediterranean,” explains Elena Oberto, researcher in the Meteorology and Climate department of CIMA Research Foundation. “This type of configuration can generate intense rainfall that persists over the same areas for several hours.”
ECMWF analyses show that as early as the early hours of March 14, an intense precipitation zone formed along a southwest-northeast axis, particularly affecting the provinces of Livorno, Pisa, and Florence, with continued activity over the following 24 hours.


Fig. 3,4,5. ECMWF maps for March 14, 2025, at 00UTC, 12UTC, and March 15 at 00UTC, provided by the Functional Center of the Aosta Valley: these maps illustrate geopotential height and temperature at 500 hPa, highlighting the atmospheric configuration that drove the intense precipitation in Tuscany.
Soil moisture conditions before the event also played a crucial role. Analyses show that soil moisture levels were already elevated on March 12, 2025, reducing the ground’s capacity to absorb further rainfall.

This situation was exacerbated by wind convergence in the lower atmospheric layers and strong sirocco winds in southern Tuscany, which further fueled precipitation. “Another key factor,” Oberto adds, “was the strong southwesterly wind at about 1,500 meters altitude. This created the perfect conditions for persistent rainfall, resulting in very high accumulations over a short period.”

The heavy precipitation also had effects beyond Tuscany, impacting the central-eastern part of Emilia-Romagna, where river levels rose significantly, and landslides were reported.


Where did it impact? Satellite monitoring
On the afternoon of March 14, the Italian Civil Protection Department activated Fondazione CIMA in collaboration with the Italian Space Agency (ASI) to monitor the flooded areas using satellite imagery. “Satellites are fundamental tools for understanding what happened and how the situation evolved in the following hours,” explains Giuseppe Squicciarino, researcher in Earth Observation at CIMA Research Foundation. “Thanks to Sentinel-1 and the Cosmo Second Generation (CSG) constellation, we obtained detailed images of the affected areas.”


On March 15, a CSG observation provided by ASI enabled the acquisition of high-resolution images (3 meters), covering Florence and nearby municipalities such as Sesto Fiorentino, Campi Bisenzio, Calenzano, Poggio a Caiano, and parts of the province. On March 17, Sentinel-1 acquired a new image with a wider coverage (250 km swath), allowing for an analysis of the entire Arno River course from Florence to its mouth.


“These images provided us with a comprehensive representation of the event. We were able to compare the situation before and after the flood, identify flooded areas, and assess the evolution of the flooding phenomenon in the following days. Such data are crucial for supporting authorities in emergency management and planning intervention strategies,” concludes the researcher.
A rare or recurrent event in the climate context?
The March 14, 2025, event stands out due to the extraordinary amount of rainfall recorded within 24 hours. According to Antonio Parodi, Program Director at Fondazione CIMA, “If we compare the observed rainfall with the March climatology, based on 40 years of ERA5 data at 3 km resolution, we see that in some areas of Tuscany, the 24-hour rainfall amounted to 300% of the monthly average. This highlights the significance of the phenomenon, but not necessarily its rarity when compared to past extreme events like the 2017 Livorno flood.”

The study of the 2017 Livorno event (Lagasio et al., 2019) showed that nearly 250 mm of rain fell in just three hours, an even more extreme value than the one recorded in March 2025, although with a different spatial distribution.
A similarity can also be identified between the flooded areas of the March 14, 2025, event and the flood of November 2, 2023. Both events were characterized by stationary precipitation bands associated with low-level wind convergence and convective activity, as also highlighted by the LaMMA Consortium analysis.
«Anche confrontando le immagini satellitari degli eventi del 2 novembre 2023 e del 14 marzo 2025, notiamo molte similitudini nelle aree allagate», aggiunge Luca Pulvirenti, referente dell’ambito Osservazione della Terra di Fondazione CIMA.

These comparisons indicate that while the March 14, 2025, event was intense and had a major impact, it was not an isolated case in the region’s meteorological history. The recurrence of similar events in recent years, with analogous characteristics in both atmospheric dynamics and precipitation distribution, suggests a shift toward a more frequent occurrence of what can be classified as “extreme” phenomena. This underscores the importance of continuously improving forecasting models and implementing effective mitigation and adaptation strategies to reduce hydrogeological risks and enhance territorial resilience.